Tydzień w gospodarce
Kategoria: Trendy gospodarcze
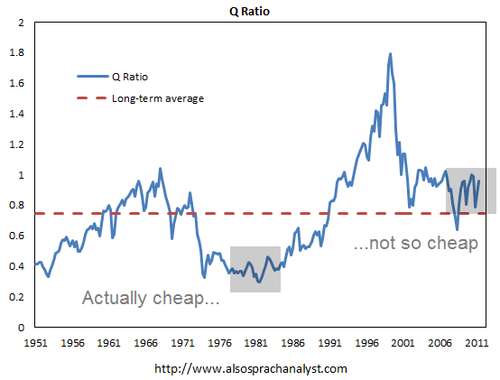
After this week’s jump in share prices, I reckon it won’t be long before some highly-paid „experts” are again heralding the arrival of another secular bull market. Unfortunately, along with all the other measures I highlighted in „Almost Laughable,”which together make it clear that valuations are nowhere near the ultra-cheap levels that prevailed three decades ago, we have another well-regarded indicator telling us a similar story, as Also Sprach Analyst reports in „Chart: Tobin’s Q Ratio for US Equities”:
Q ratio is a measure of whether equities’ valuations are, as a whole, attractive or not, invented by James Tobin. Conceptually it is measured by dividing the market value of equities by the replacement costs of equities.
The variables used to calculate this ratio is in the Z1 Flow of Fund Accounts, with the latest just published by the Federal Reserve. Here’s how Q ratio looks like, computed by using line 35 of table B.102 divided by line 32 of table B.102. As you can see, stock market reached an extreme during the tech bubble, and has gone through a long period where the ratio contracted to around unity. However, if the previous great market bottoms could be of any guide, the Q ratio at the current level remains both above the long-term average and the lowest point in the history [gray annotations mine].


