Tydzień w gospodarce
Category: RaportyPrzegląd wydarzeń gospodarczych ubiegłego tygodnia (16–20.05.2022) – źródło: dignitynews.eu

Many economists (both and professionals) seem to be absolutely convinced that the rising public debt levels will sooner or later result in accelerated inflation.
However, documented history makes us doubt the validity of the claim that rising public debt is a “pro-inflationary factor.” During the Great Recession, which began in 2008, public debt levels (relative to GDP) increased significantly in almost all countries without causing higher inflation. In the years 2008-2018, the average annual inflation rate was only 1.1 per cent in the euro zone (consisting of 12 Western European countries). The average inflation rate was 1.2 per cent in Germany, 1.6 per cent in the United States, and 0.4 per cent in Japan. Of course, one can always assume that in some unspecified “longer” time horizon, inflation will either accelerate, or be initiated by the authorities (in order to effectively reduce the real public debt levels).
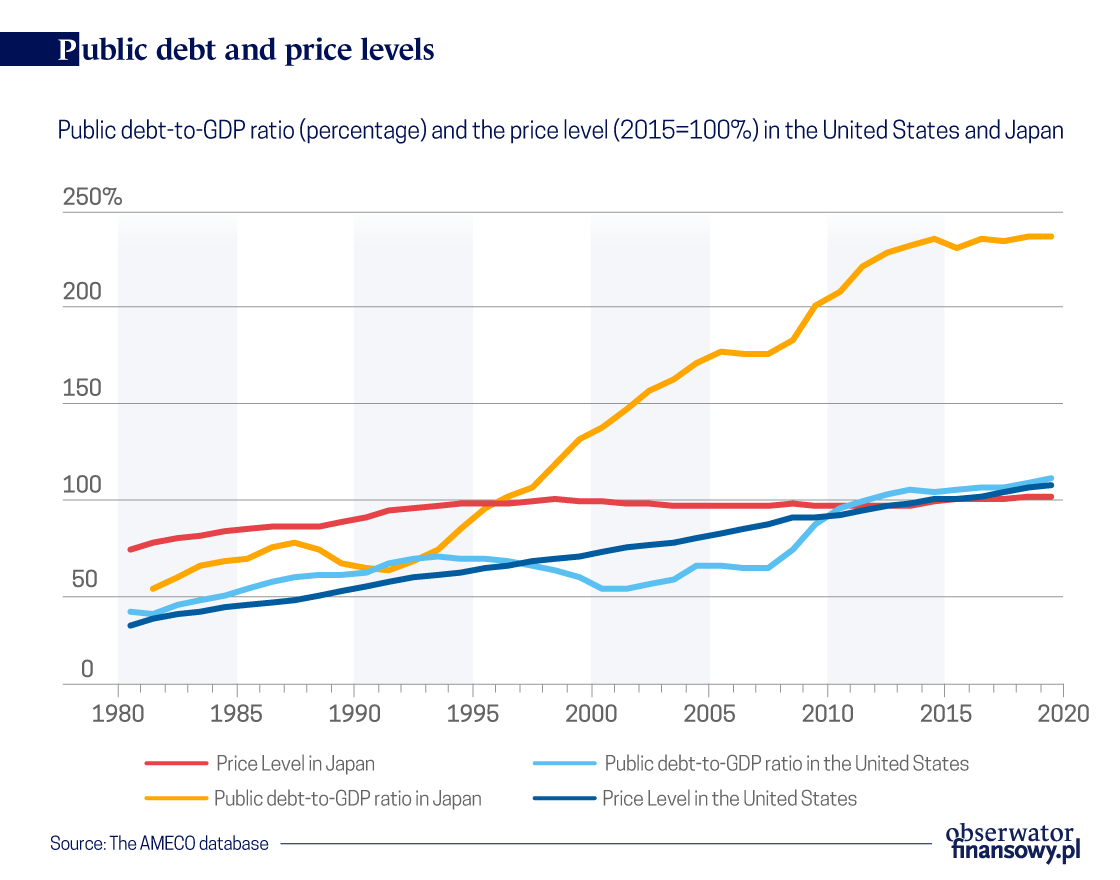
For the United States and Japan, we have access to longer time series data concerning the price levels and the public debt levels. It’s clear that the level of Japan’s public debt has been rising sharply since 1992 – without any noticeable increase in the price level. In fact, the prices in Japan have been stable since 1994 (with a slight deflation in the years 2008-2013). The situation is less obvious when it comes to the United States. Both the price level and the level of public debt have exhibited an upward trend (public debt has been increasing since 2000, while prices have been rising since 1980). In this case it’s hard to draw any conclusions about potential “causality” without going deeper into the data.
Econometric analysis of causality for the United States and Japan
The standard tool of econometrics is the analysis of causality (or rather, lack of it) introduced by the Nobel Laureate Clive Granger in 1969. The data from the chart can be tested for the presence (or absence) of causality (in the sense defined by Granger). The details of these tests can be found in my publication. Here, I will briefly present the conclusions drawn from these analyses.
It turns out that for the United States the public debt level (as a percentage of the GDP) does not Granger-cause the price level (i.e. it is not the cause “in Granger’s sense”), and that the price level does not Granger-cause the level of public debt. Translated into everyday language, the public debt is a bad leading indicator of price levels (and vice versa). In the case of Japan, it turns out that the price level does not Granger-cause the level of public debt, but the level of public debt Granger-causes the price level (i.e. it is the cause “in Granger’s sense”). However, as suggested by the chart, the debt level actually appears to be negatively correlated with the level of prices!
Causality can also be tested with regard to the relationship between the inflation rate and the rate of growth of the debt-to-GDP ratio. It turns out that in the case of Japan we are dealing with a two-way causality. The inflation rate Granger-causes the rate of growth of the debt-to-GDP ratio, and vice versa. For the United States, the inflation rate Granger-causes the rate of growth of the debt-to-GDP ratio, but the causal relationship does not run in the opposite direction! The growth in debt is not the cause of the inflation rate “in Granger’s sense”. In other words, growth in the percentage share of debt in relation to GDP is not a predictor of inflation growth.
The Granger causality test doesn’t allow us to determine the direction of the causal relationship (and its possible strength) between one phenomenon and another phenomenon. The direction and the strength of the causal relationship can be tested – in relation to the rate of inflation and the rate of growth of the debt-to-GDP ratio – using the vector autoregression (VAR) method.
Using the VAR method, I have arrived at the following conclusions:
The experience of other European countries
The AMECO database provides data on the debt-to-GDP ratios and the price levels for all countries of the European Union (and the United Kingdom) since 1995. These data were also subjected to “Granger causality” tests. It turns out that the public debt-to-GDP ratios can be considered to Granger-affect the price levels only in a few countries. This includes “fiscally conservative” countries with a very low level of public debt (Luxembourg, Sweden, Lithuania), as well as euro area countries, which have very high levels of debt and are – at least in the discussed time period – “kept on a short leash” by the European Commission (Greece, Portugal, Italy Spain, Ireland). In the case of the remaining EU member states (as well as the United Kingdom, Japan, and the United States), in the period in question it is not possible to confirm a causal relationship between the level of public debt and the price level.
Granger-causality running from the rate of growth of the debt-to-GDP ratio to the inflation rate cannot be ruled out in only 8 of the 29 analyzed countries. Outside of Japan, these are either fiscally conservative countries (Luxembourg and Sweden) or beneficiary countries of financial assistance programs (Greece, Italy, Latvia, Ireland). In the case of Luxembourg and Sweden the causal relationship is “negative”, just as in the case of Japan. Interestingly enough, in the case of 8 countries (including Germany and France), it is impossible to rule out reverse Granger-causality running from the inflation rate to a change in the debt-to-GDP ratio. Based on data for the years 1995-2019 it is impossible to establish any causality for Poland.
Conclusions
In conclusion, the analysis of long term time series data for a large number of countries shows that the public debt-to-GDP ratio is in general a poor leading indicator for the price level and that the growth rate of the public debt-to-GDP ratio is in general a poor leading indicator for the inflation rate. Moreover, in a few cases where there is Granger-causality running from the growth rate of the debt-to-GDP ratio to the inflation rate, we are actually dealing with a negative impact, which decreases inflation! The widespread belief that fiscal deficits (and growing public debt levels) must ultimately lead to higher inflation is not supported by empirical evidence. Of course, we should keep in mind that the countries considered above are all market economies where there is a demand barrier. The situation could be different in economies limited by supply shortages, such as centrally-planned economies or wartime economies.