
(©Andrzej Barabasz, Chepry, CC BY-SA 4.0)
The data on consumption per capita in purchasing power standards for 2018 released by Eurostat is based on revised purchasing power parities, and the latest GDP and population figures. In order to get the most accurate data possible, Eurostat refrained from measuring simple household consumption, and focused on actual individual consumption (AIC). According to Eurostat, AIC “consists of goods and services actually consumed by individuals, irrespective of whether these goods and services are purchased and paid for by households, by government, or by non-profit organizations.”
This makes AIC a more accurate estimate of actual household consumption compared to simple household consumption, which doesn’t include spending on certain important services consumed by households, such as health and education services.
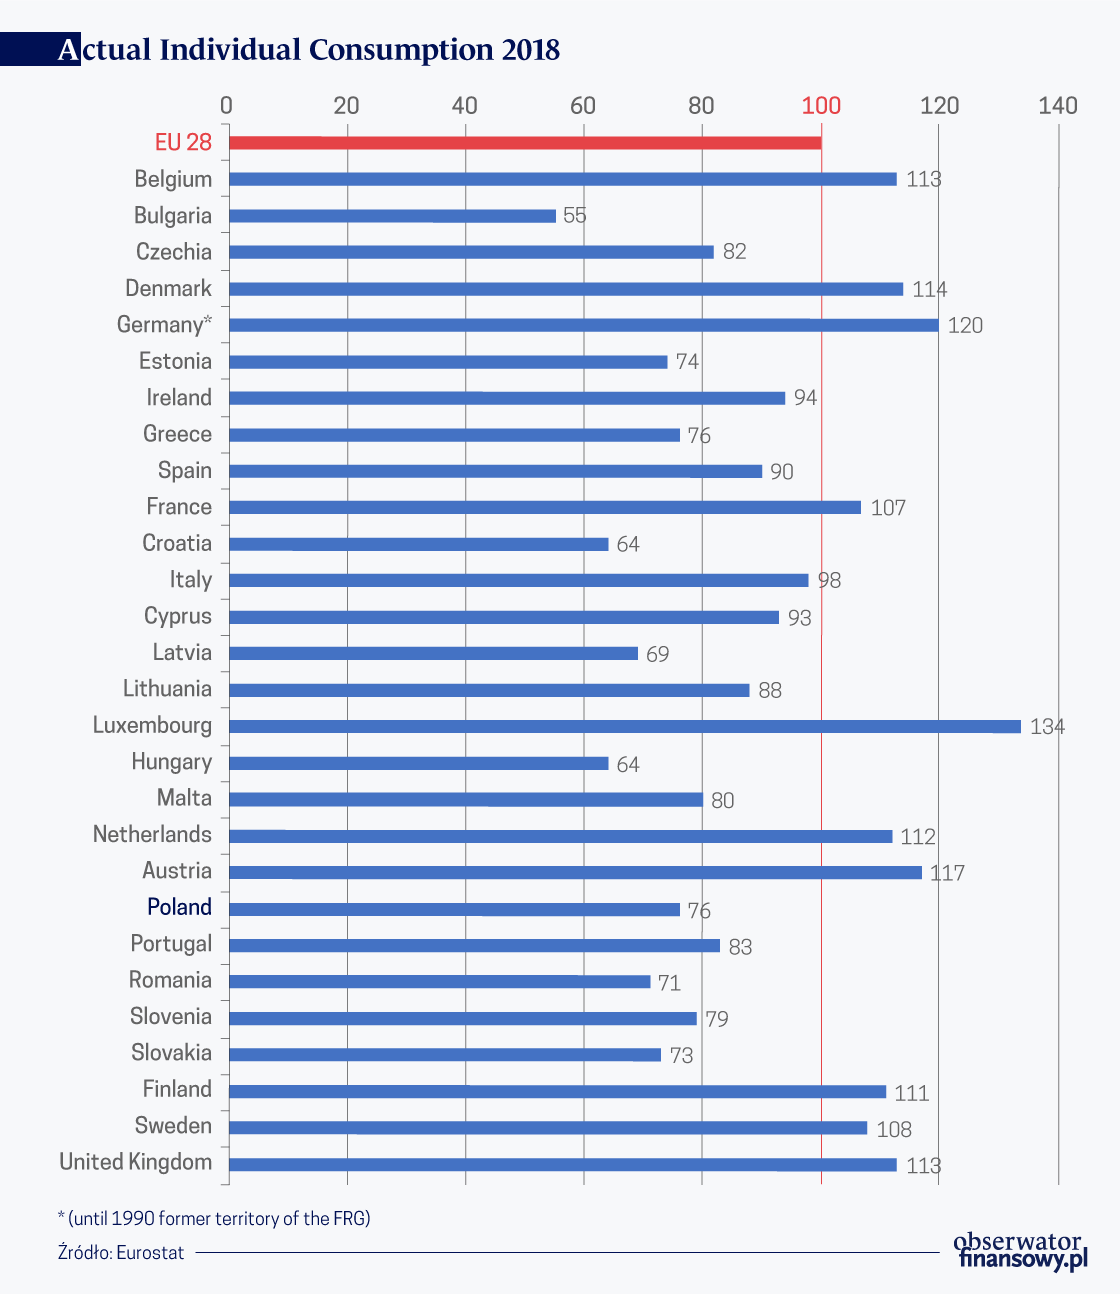
The actual individual consumption of the EU member states varies. The highest AIC per capita expressed in Purchasing Power Standards (PPS) was recorded in Luxembourg, where it reached 134 per cent of the EU average. Bulgaria found itself on the other end of the spectrum with only 56 per cent.
Out of the 28 member states of the European Union, only ten recorded AIC per capita above the EU average. “Ten Member States recorded AIC per capita above the EU average in 2018. The highest level in the EU was recorded in Luxembourg, 34 per cent above the EU average, ahead of Germany (20 per cent above). They were followed by Austria, Denmark, Belgium, the Netherlands, the United Kingdom, Finland, Sweden and France with levels of 7 to 17 per cent above the EU average,” said Eurostat. This means that nearly two thirds of EU member states are below average, as far as AIC is concerned.
“AIC per capita for fourteen Member States lay between the EU average and 30 per cent below. In Italy, Ireland, Cyprus and Spain the levels were 10 per cent or less below the EU average, while Lithuania, Portugal, Czechia and Malta were between 10 per cent and 20 per cent below. Slovenia, Greece, Poland, Estonia, Slovakia and Romania were between 20 per cent and 30 per cent below the average. Four Member States recorded AIC per capita more than 30 per cent below the EU average. Latvia, Croatia and Hungary were between 30 per cent and 40 per cent below, while Bulgaria had AIC per capita more than 40 per cent below the EU average,” the report said.
Even though there haven’t been any major changes in consumption habits in most EU member states, a few countries registered a noticeable increase. For instance, Romania’s AIC went up from 65 per cent of EU average in 2016 to 71 per cent in 2018. Similarly, Lithuania’s consumption went up from 85 per cent to 89 during the same time period.
Comparison to GDP per capita
Although there are certain similarities between GDP per capita and actual individual consumption, the latter statistical unit is arguably a much more reliable source of information on the actual material welfare of countries. According to a definition given by Eurostat, “gross domestic product (GDP) is a measure for the economic activity. It is defined as the value of all goods and services produced less the value of any goods or services used in their creation.” As already noted above, AIC, on the other hand, is a measure of all goods and services actually consumed by households. In other words, while GDP measures the overall value of products and services produced in a country, AIC measures the total value of goods and services consumed by households in that same country.
While the value of AIC doesn’t differ much from GDP per capita in most member states, there are a few striking discrepancies in some countries. A good example is Ireland, a relatively wealthy country with a GDP per capita reaching 189 per cent of the EU average in 2018. However, during the very same time period, the northwestern European country reached only 95 per cent of the EU’s average AIC per capita. Ireland’s actual wealth level declined from 102 in 2010 to 98 in 2012, making it only the 12th richest country in the EU.
Ireland is a particularly interesting example given the presence of large multinational corporations, such as Apple. In 2015, Irish’ GDP grew by 25 per cent y/y. The initial euphoria was later replaced by skepticism when it came to light that the sudden rise in Irish economy was largely caused by Apple’s restructuring their Irish subsidiary. Since then, there have been many voices proposing a new metric to measure the “real” Irish economy.
Similarly striking is the difference between GDP per capita and AIC per capita in Luxembourg. While the multilingual, western European country enjoys GDP per capita at 261 per cent of EU average, it’s AIC per capita is “only” 134 per cent.
Out of the 28 member states of the European Union, 11 show higher consumption figures than GDP per capita (expressed in relation to the European Union average set to 100). Those countries are the following: Bulgaria, Greece, France, Croatia, Italy, Cyprus, Lithuania, Poland, Portugal, Romania, and the United Kingdom. The rest of the EU member states registered lower consumption rates than GDP rates in 2018.
Filip Brokeš is an analyst and a journalist specializing in international relations.