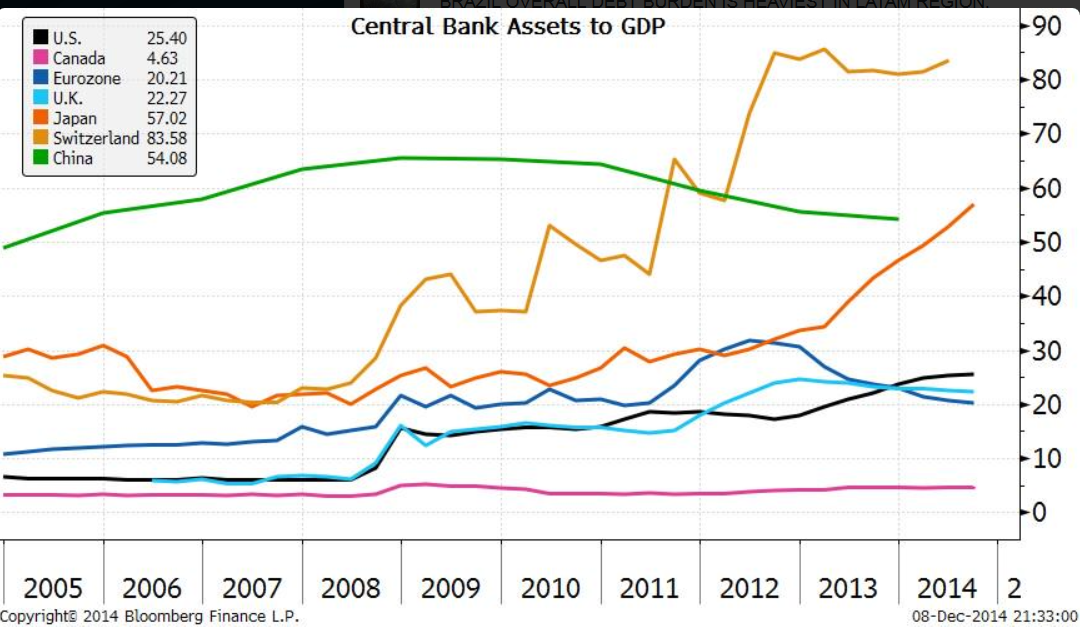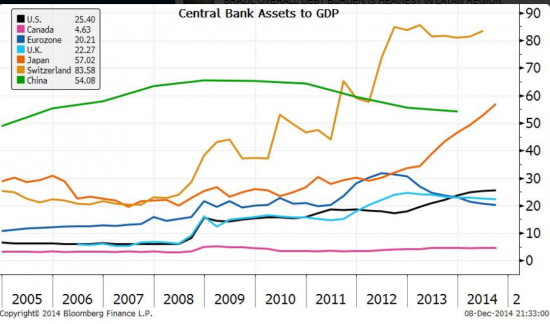
This Great Graphic was tweeted by Michael McDonough, the global head of economics for Bloomberg and its chief economist. It shows in one chart the assets of the central banks of many countries, including China (green line).
Does the expansion of a central bank’s balance sheet let us forecast currency movement? It is not immediately clear. It depends on where one begins the story.
Until 2011, China’s central bank had the most assets relative to GDP than the other countries. Since the start of 2008, the yuan has outperformed the other currencies represented here. It has risen 18% against the dollar. The Swiss National Bank has seen the largest expansion of its balance sheet since the crisis, and its currency has appreciated 16.6%, making it the second best performing currency here.
It appears that end of last year, the size of the balance sheets of the Federal Reserve, Bank of England and the European Central Bank converged around 20% of GDP. Since the end of 2007, sterling has fallen 21.2%, against the dollar, while the euro has decline 15.2%.
Under Kuroda’s leadership, the Bank of Japan’s balance sheet has expanded at a rapid pace. Since Abe was elected, at the end of 2012, the yen has been among the worst performing currencies, losing almost 36% of its value against the dollar. Other factors have also played a role. Most recently the portfolio diversification of Japan’s pension funds also involved the sales of yen. And don’t forget that until a few months ago, the yen had actually appreciated from the end of last year.
Although it is easy to say that expanding central bank balance sheets undermine currencies. However, the data suggests a more complicated understanding is necessary. Monetary policy is one set of considerations that can drive the foreign exchange rates, but there are other drivers as well. The challenge is trying to identify the drivers, which can shift over time.