The Wall Street Journal’s Josh Zumbrun posted these twoGreat Graphics on equity ownership in the US.Economists often see the rise in equity prices having two important channels of economic impact. The first is it simply lowers the price of capital for companies. It is straight forward enough, though not all companies are publicly traded. Rising equity prices are the decline in the cost of capital to large companies.
The second is the wealth effect. People feel wealthier, even if it is on paper (unrealized), and therefore it may increase the marginal propensity to consume. However, the challenge here is that participation in that wealth-creating channel is limited and falling. A Gallup survey last year found that 52% of American households own stocks. Equity ownership peaking in 2007 near 65%.
While these aggregate numbers of help, the extreme disparity of wealth suggests digging deeper is necessary. This is where the Zumbrun’s charts, drawn from Federal Reserve data, are useful.
This first chart shows the distribution of stock ownership by percentile of income and age. Less than a quarter of the households in the lowest two quintiles own stock. Nearly half of the middle quintile own stock.
The problem with looking at income is that a rising number of Americans are retired and draw no or little income. That many young people (younger than 35 years old) is disappointing, but not surprising, especially given the rising costs of college and student indebtedness on one hand, and low wages on the other. As the right hand part of the graph illustrates, retired folks also participate to a lesser extent in the equity market. This makes sense given the life cycle of investment: accumulate when you are young, dis-accumulate when you are older. Moreover, the conventional wisdom is as one ages one should shift toward fixed income rather than equities. Still, the median 65-74 year-old household has $117.5k in equities (admittedly still skewed by the non-normal distribution).
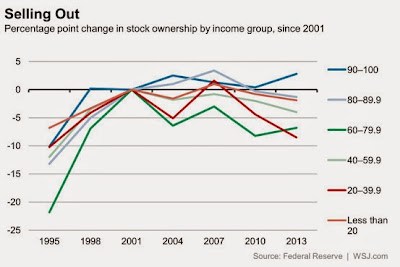
This second chart from Zumbrun shows the change in ownership by income group since 2001.It shows a decline in ownership in every income group except the top decile (dark blue line). There was a sharp increase participation in the second half of the 1990s. The end of the tech bubble hurt many.
The 60%-79.9% quintile (green line) never recovered from the tech bubble. And like the lower quintiles, the slowing of the migration out of equities in the lead-up to the sub-prime crisis, was re-accelerated . However, over the last couple of years, the 60%-79% quintile has slowed its outflow again. The 80%-89.9% (second decile mauve line) continues to dis-accumulate equities at an increased pace.
This suggests the rally since the 2009 low has seen less participation that the crash did. In turn that means that the wealth effect from record high stock market may be more limited than in the recent past. Moreover, if these trends continue, it means that the stock market itself will be increasingly a catalyst for the divergence of wealth.
The equity market breaks down the risks of ownership into small, tradeable units and allows widespread dispersion. in contrast, the equity markets in Japan and Germany, for example, seemed traditionally more about solidifying inter-company alliances. Indeed, the beneficiary owner of a majority of American equities are US households. These employees and former employees own (but of course do not manage or control) Corporate America. This is why the founder of business management as a science, the late Peter Drucker could argue America is at one and the same time the most capitalist and most socialist country in the world.
The Founders of the United States understood that the widespread ownership of productive (not personal property) property was the bulwark of a representative form of government. A continued decline in home and equity ownership is a worrisome sign then not only on economic grounds, as Yellen (among others) have highlighted, but also on political grounds.
Ekspansja fintechów nie pozostaje bez wpływy na działalność banków, ich przychody i politykę ryzyka. Funkcjonowanie nowych graczy jest wyzwaniem, ale przynosi także efekty pozytywne dla sektora bankowego.
Stany Zjednoczone są jedynym militarnym supermocarstwem świata: wydają na siły zbrojne więcej niż dziesięć kolejnych krajów łącznie. Chiny natomiast stały się jedynym na świecie supermocarstwem w przetwórstwie przemysłowym (manufacturing). Produkcja Chin przewyższa produkcję dziewięciu następnych krajów na liście razem wziętych.
Po dwóch latach deficytu, Polska odnotowała w 2023 r. dodatnie saldo w obrotach handlowych. Poprawa salda nastąpiła we wszystkich głównych kategoriach towarów, a najsilniej w paliwach. Głównym czynnikiem tych tendencji były wyraźnie lepsze warunki cenowe w polskim handlu zagranicznym.
Produkcja ropy na Alasce znalazła się na poziomie najniższym od 45 lat. Ludzie wyjeżdżają stamtąd. Stan ma problemy budżetowe, które będzie chciał załatać m.in. uruchomieniem sprzedaży kredytów węglowych.
Portugalia nie wykorzystała możliwości, jakie dawało wstąpienie do Unii Europejskiej, a wręcz cofnęła się w rozwoju gospodarczym w minionych prawie dwudziestu pięciu latach. W niniejszym artykule autor przekonuje, że ten rozczarowujący rezultat wynika w dużej mierze z polityki ukierunkowanej na bieżącą konsumpcję zamiast na rozwój oparty na sektorze prywatnym.
Liberalizacja handlu jest głównym celem partnerstwa gospodarczego z Kenią. W perspektywie długoterminowej chodzi także o zwiększenie zaangażowania UE w Afryce.
Specjalne wydanie „Obserwatora Finansowego”, poświęcone jest najważniejszym reformom w historii polskiej bankowości. Powodem jest okrągła rocznica stu lat od kluczowych dla dzisiejszych sukcesów Polski wydarzeń. Jaką drogę przeszedł polski złoty od powstania, do chwili obecnej? Na czym opiera się wiarygodność i zaufanie do Narodowego Banku Polskiego? Jakie były wyzwania i alternatywy po drodze? O tym wszystkim można przeczytać w wydaniu kwartalnika.
Najnowsze wydanie „Obserwatora Finansowego” ukazuje nam wizje przyszłości bliskiej i dalekiej. W tym numerze, najlepsi eksperci postarają się odpowiedzieć na kilka kluczowych pytań, dotyczących sztucznej inteligencji i tego jak generatywna AI wpłynie na bankowość, edukację oraz inne dziedziny naszego życia.
Nieefektywność nadzoru prowadzi do występowania nieprawidłowości i nadużyć na rynku funduszy inwestycyjnych w Polsce – taką sensacyjną tezę stawiają autorzy monografii „Nieprawidłowości i nadużycia na rynku funduszy inwestycyjnych”.
W zasadzie przesądzone zostało wprowadzenie cyfrowej waluty w ujęciu globalnym. Pozostaje natomiast pytanie, jak długo państwa posiadające własne banki centralne, zdolne do kształtowania mniej lub bardziej polityki monetarnej, będą mogły opóźniać wprowadzenie cyfrowego pieniądza banków centralnych (CBDC – Central Bank Digital Currency) i jak długo gotówka pozostanie w niektórych państwach alternatywnym środkiem płatniczym, zabezpieczając konkurencyjność obrotu gospodarczego i wolność wyboru?
Sztuczna inteligencja powoli zmienia sposób działania banków i instytucji finansowych. Pomaga im zredukować ciężar biurokracji, ale także podejmować szybsze decyzje oraz utrzymywać efektywny kontakt z klientami. A będzie jeszcze lepiej. W perspektywie czeka kilkunastoprocentowy wzrost EBITDA.
Współczesne problemy prawne Unii Europejskiej, sztuczna inteligencja w bankowości oraz polityka pieniężna były tematami grudniowego zjazdu na podyplomowych studiach MBA organizowanych w ramach drugiej edycji projektu „Akademia NBP”.
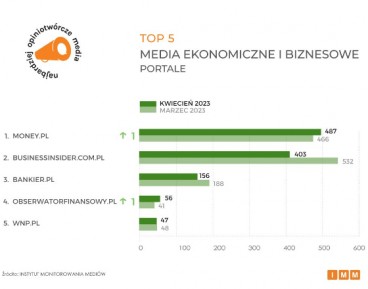
Portal ekonomiczny NBP „Obserwator Finansowy” ponownie znalazł się w czołówce najbardziej opiniotwórczych mediów w kategorii „Media ekonomiczne i biznesowe”, wyprzedzając m.in. „Parkiet”. Wzrost cytowalności treści publikowanych na łamach serwisu wzrósł w kwietniu w odniesieniu do marca 2023 r. o 37 proc.
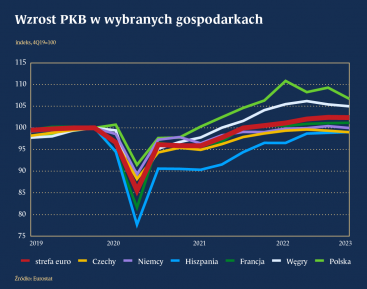
Sytuacja gospodarcza w Polsce na tle innych krajów przedstawia się korzystnie. Warto zauważyć, że w szybkim tempie nadrabiamy dystans dzielący Polskę od poziomu życia w wybranych państwach europejskich. W ciągu ostatnich czterech lat dynamika wzrostu PKB plasowała Polskę powyżej innych krajów europejskich, zarówno strefy euro, w tym Niemiec i Francji, jak i krajów Unii Europejskiej z własną walutą, np. Czech.
Większość polskich przedsiębiorców odczuła skutki wojny w Ukrainie, choć jej wpływ oceniają w zróżnicowany sposób – wynika z badania przeprowadzonego przez Polski Instytut Ekonomiczny.
W styczniu 2020 roku Wielka Brytania formalnie opuściła Unię Europejską. Oczekiwane korzyści z brexitu, poza odzyskaniem suwerenności w zakresie kształtowania prawa i zewnętrznych relacji gospodarczych, jednak się nie zmaterializowały. Widoczny jest natomiast spadek wydajności i konkurencyjności brytyjskiej gospodarki, co wpływa także na kondycję rynku pracy.