Tydzień w gospodarce
Category: RaportyPrzegląd wydarzeń gospodarczych ubiegłego tygodnia (25–29.04.2022) – źródło: dignitynews.eu


(CC BY-SA Ken Teegardin/DG)
Recent years have been a golden period for the TFI sector. In 2010-2011, the funds generated high net earnings, with the capital they managed at more than PLN 100 billion. The subsequent three years have also brought market growth. An increased interest of Poles in saving and investing in the capital market has also been observed.
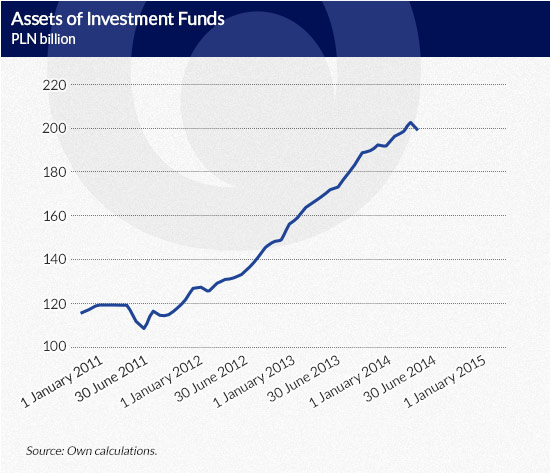
In 2011, the capital accumulated in investment funds remained at an almost unchanged level – a 1.28% decline was noted in comparison to 2010. This was due to the turmoil in world stock markets, which impaired the investment performance of individual funds. Consequently, a number of people redeemed their participation units. On the other hand, since the beginning of 2012, a significant and steady increase in the value of assets managed by TFIs has been registered.
According to the data published by the Chamber of Fund and Asset Management, the assets amounted to PLN 114.65 billion at the end of 2011 and they exceeded PLN 200 billion in June 2011. This is a record and hitherto unregistered level of funds accumulated by investment funds in the domestic market.
Infographics by Dariusz Gąszczyk
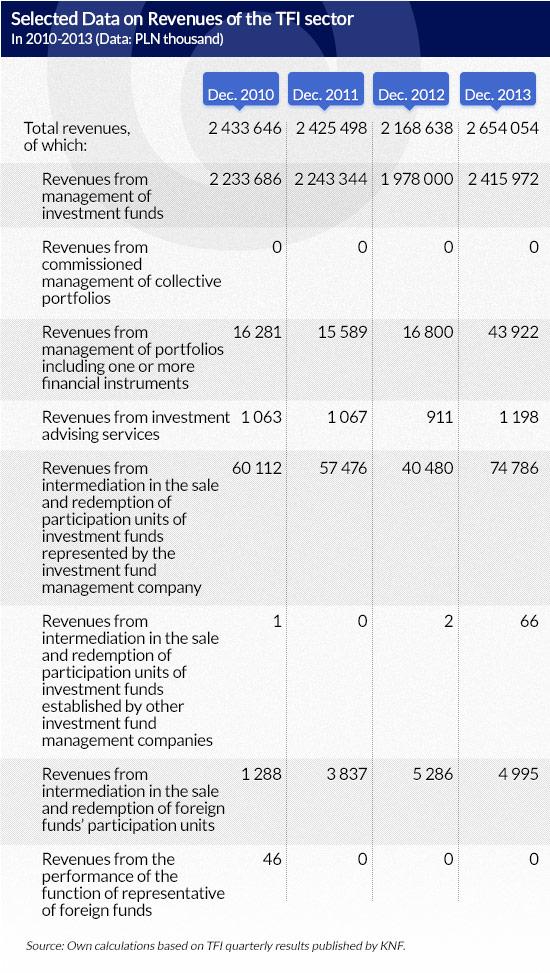
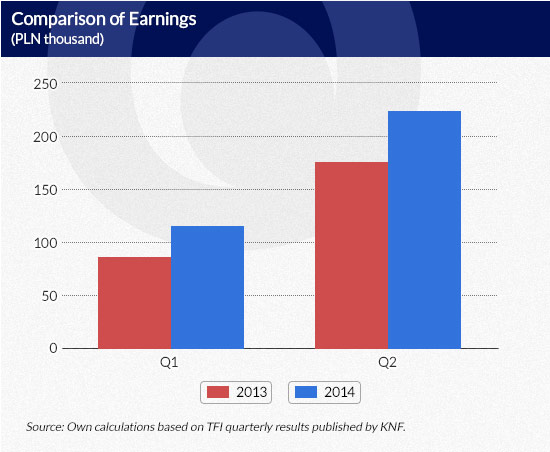
The impressive growth in the value of the funds’ assets (27.2% in 2012, 29.6% in 2013 and 5.3% by the end of July 2014) was not accompanied by an increase in profits. Aggregate data compiled by the Polish Financial Supervision Authority (KNF), based on TFIs’ monthly reports, indicate that net earnings have been dwindling since 2011 (see Figure above).
In 2011, the profit declined by 3.24% y/y and in 2012 – by as much as 24.08%. Moreover, the low reduction in total costs (by 6.97%) did not compensate the fall of revenues in 2012. As a result, the sector’s earnings were significantly lower. The good economic situation in the investment fund market in 2010-2011 returned in 2013. The sector’s profit rose by 31.05% y/y to PLN 426 million but remained lower by 0.5% than in 2011 and by 3.72% lower than in 2010.
The fee for investment fund management, which is the main source of TFI revenues, amounted to PLN 2,415,972 thousand in 2013 and was higher by 22.14% as compared to the previous year and by 7.7% as compared to 2011. The quick rise in revenues in 2013 was ultimately reduced by the large increase in variable distribution costs, which made it impossible for TFIs to generate a profit similar to the 2010 and 2011 figures.
Infographics by Dariusz Gąszczyk
What made revenues go down in 2012-2013? The reasons can be found in the change of investor preference.
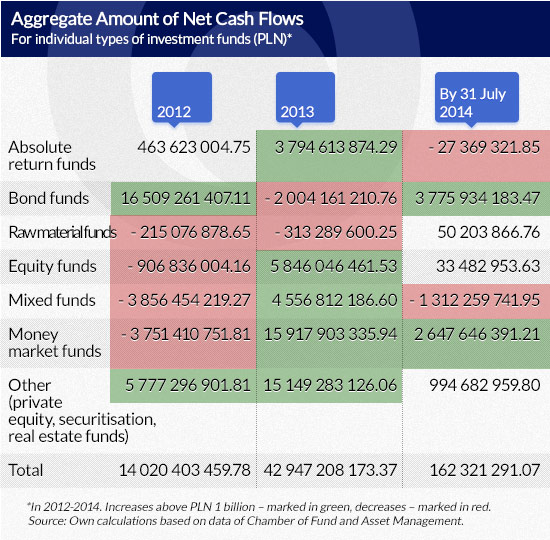
In 2012, due to the worsening economic situation the Monetary Policy Council lowered interest rates. This decision translated into lower interest on term deposits, and bank clients started to look for more profitable yet safe forms of increasing wealth. This led to an increased interest in bond funds, particularly government bond funds. These funds registered the largest asset growth among all types of funds in 2012, while raw material, equity, mixed and money market funds fell into disfavor with investors. These market segments suffered a massive capital outflow, which was probably the effect of strong turmoil in the capital market in the second half of 2011 and falling confidence in equity funds.
The year 2013 saw a decisive turnaround in customer investment demand. This time it was bond and raw material funds that faced the largest number of participation unit redemptions. Other funds however saw a huge inflow of funds. Money market funds and other types of funds (private equity, securitisation, real estate funds, etc.) saw a booming rise in interest.
In 2012-2013, big interest in closed-end non-public assets funds certainly came on the back of amendments to legal regulations, announced with the aim to limit the attractiveness of this type of funds. The funds are used by large investors mainly for tax optimisation purposes. A number of investors wanted to have the last chance to reduce their taxes.
Infographics by Dariusz Gąszczyk
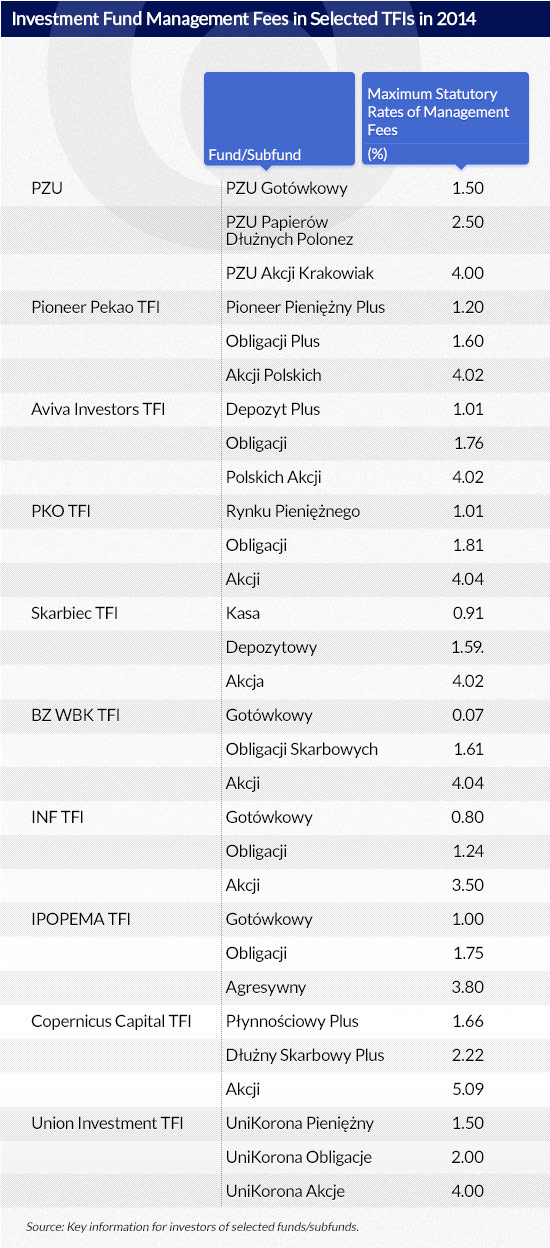
Changes in investor demand are directly reflected in the level of revenues from the management of clients’ capital since TFIs charge different fees depending on the type of the fund. The lowest fees are charged in the segment of money market funds, higher fees – by bond funds and the highest fees – in the segment of equity funds.
Infographics by Dariusz Gąszczyk
Overall, the sector posts better net earnings when the level of capital is high in equity funds and it posts worse results when the majority of assets are collected in debt funds and money market funds.
The year 2014 is characterised by a further inflow of capital to investment funds, coupled with a new change in the trend of investor demand. This time safe solutions – money market and bond funds – are back in favour. Among mixed funds, however, redemptions of participation units prevail. Equity funds continue to display a high level of assets, which is a positive sign. Yet, what is worrying is the relatively low inflow of capital to funds (assets grew only by PLN 6.16 billion in the first seven months of 2014). This result is lower than half of net cash flows in both 2013 and 2012.
Profits generated by the sector stand out positively. According to KNF data of 25 August 2014, net profits earned by all investment fund management companies in the first half of 2014 were over half of the last year’s profits. Therefore, the sector is likely to report a higher profit in 2014 than in 2010.
Infographics by Dariusz Gąszczyk
Katarzyna Domańska is a graduate of Finance and Accounting of the Warsaw School of Economics. She was a member of the Students’ Scientific Circle of Finances.